




Eoscala is part of the Naissance World Model, a digital model of human society from 10000BC-2025AD.
- E-mail: vf@confoederatio.org
- Collation: Github | Projects
- Dataview: https://dataview.confoederatio.org
- Download:
-
- Stadestér (Cities, part of Velkscala) | Github | Projects (1.1)
-
- Velkscala (Demographics) | Github | Datavault (1.0)
-
- Eoscala (Economics) | Github | Datavault (1.5)
-
- Atlas (Polities) | Github | Datavault (0.7)
Warning
Professions currently use original estimates further back. If you would prefer, CAD-Preservés has geospatialised employment datasets from BR Mitchell's International Historical Statistics from 1750-2000, and the Global Collaboratory on the History of Labour Relations for 1500-2000.
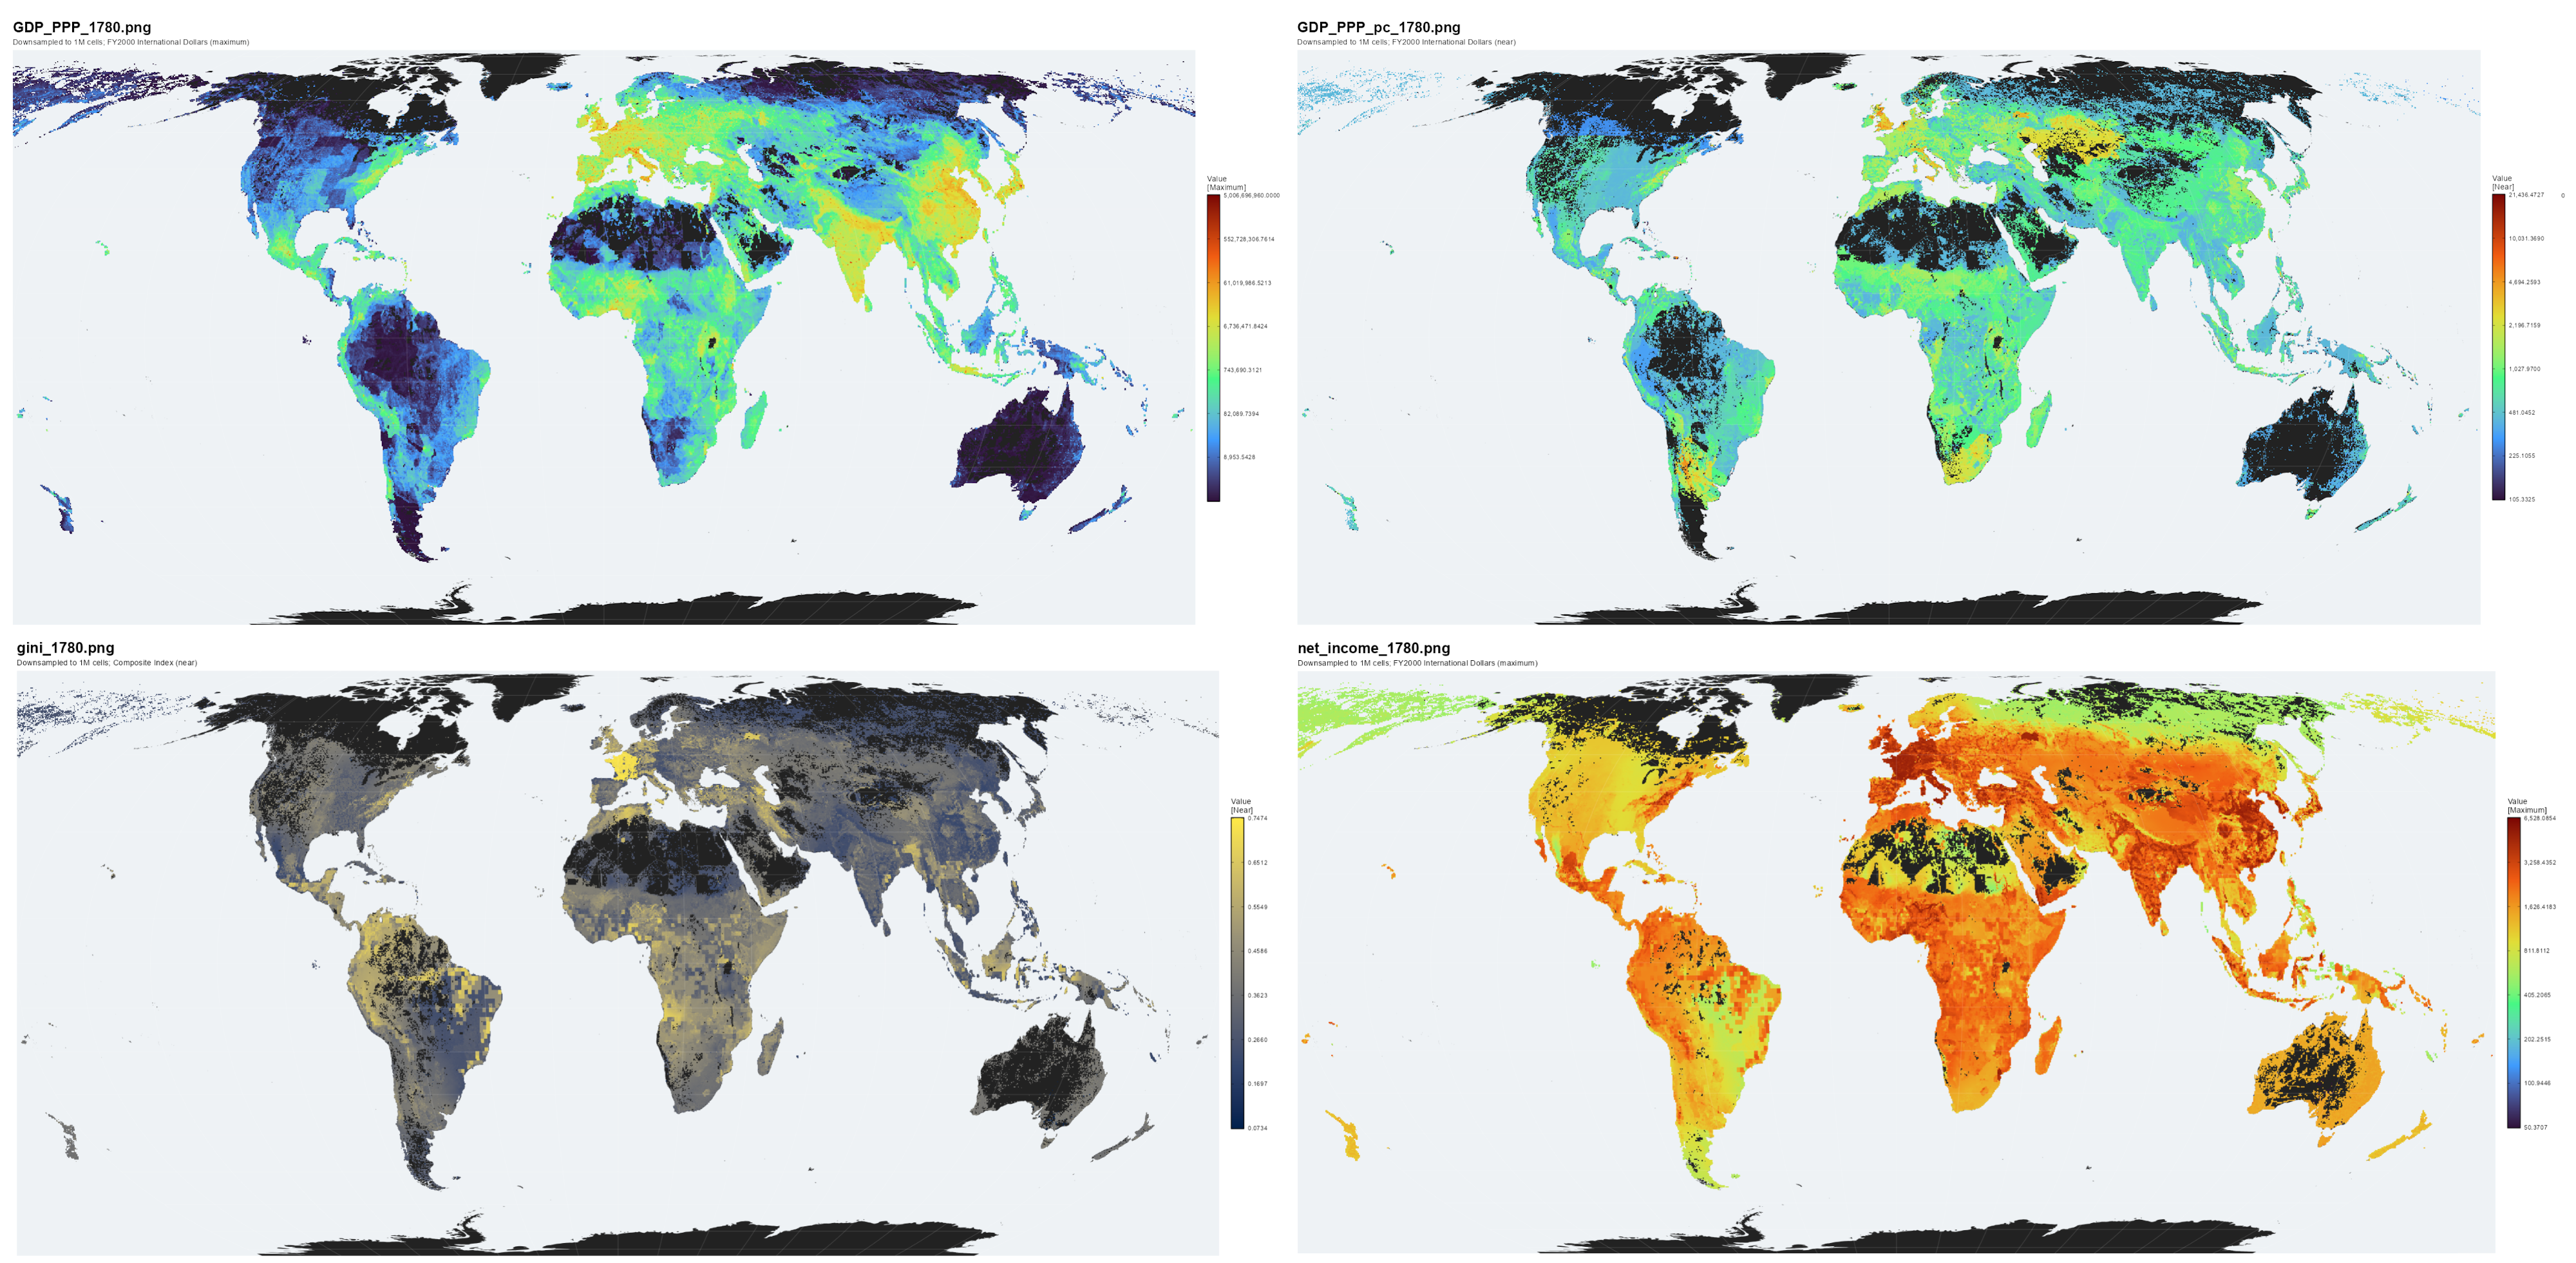
Eoscala is a geospatial database of economic indicators from 10000BC-2025AD, at 5-arcmin resolution. Most rasters are WGS84 Equirectangular, 4320x2160, and split into 128 timesteps: 1000-year intervals from 10000BC to 1AD, 100-year intervals from 1AD-1700AD, 10-year intervals from 1700AD-1950AD, and 1-year intervals from 1950AD-2025AD. Cells with <1 inhabitant are excluded from per capita calculations.
This is the testing and validation repository for Eoscala, a geospatial database on economic indicators and national accounts from 10000BC to 2025AD. Most of this work is achieved via proxy modelling. Figures and methods reports are prepared here, sorted by version. In certain cases we have chosen to preserve the statistical borders used by historians or statisticians in secondary/aggregate sources for academic purposes. Some borders may therefore be anachronistic.
For prior versions of Eoscala/Velkscala before 1.5/1.0, check the Releases tab.
Percentage data is normalised from 0-1.
admin_modern/- Subadministrative divisions used in Eoscala 1.5/Velkscala 1.0 processing.geocodes.csv: ISO3 geocodes tablegeocodes.png: ISO3 rasterhmd.png: Special area codes used by the Human Mortality Database (HMD).hmd_geocodes.csv: HMD geocodes tableiso2.png: ISO2 raster used by the World Inequality Database (WID).iso2_geocodes.csv: ISO2 geocodes tableiso3_ilo_geocodes.csv: ISO3 geocodes table used by ILOSTAT.
GDP_nominal/- GDP (Nominal), aggregateGDP_nominal_pc/- GDP (Nominal) per capitaGDP_PPP/- GDP (PPP), aggregateGDP_PPP_pc/- GDP (PPP) per capitagini/- Economic inequality. This is a composite index of assessed wealth Gini (prior to 1800AD) and income Gini (after 1800AD), since wealth Gini after 1800AD is of limited utility due to changes in financial/legal structures.labourforce/- Economically active workforce, aggregatelabourforce_f_<year>.png- Female active labourforcelabourforce_m_<year>.png- Male active labourforcelabourforce_t_<year>.png- Total active labourforce
LFPR/- Labourforce Participation Rate (LFPR). Determines share of working-age cohorts active in the workforcelfpr_f_<year>.png- Female LFPRlfpr_m_<year>.png- Male LFPR
national_accounts/- Tabular modern national and subnational accounts from 1800AD onwards.- Note. To procedurally generate
national_accounts/rasters, you will require the usage of both theadmin_modern.jsandwealth_income_WID.jsclasses; whose configs can be modified to suit your purposes. This assumes the usage of Vercengen. data/- Raw data per ISO2 country in.csvform. Restricted to enumeration years.metadata/- Metadata containing variable names by subdivision and cohort indicator.
- Note. To procedurally generate
professions/- Share of employment by economic activity.percentage/- Percentage data.
Note. Summing up percentages may result in figures >100% if including thosenot_in_work.agriculture_f/m/t_<year>.png- % of Female/Male/Total Workforce in Agriculturemanufacturing_f/m/t_<year>.png- % of Female/Male/Total Workforce in Manufacturingservices_f/m/t_<year>.png- % of Female/Male/Total Workforce in Services.informal_labour_f/m/t_<year>.png- % of Female/Male/Total Workforce in Informal Labour.not_in_work_f/m/t_<year>.png- % of Female/Male/Total Workforce not in work.
total/- Aggregate workforce per economic activity.agriculture_f/m/t_<year>.png- Total Female/Male/Total Workforce in Agriculturemanufacturing_f/m/t_<year>.png- Total Female/Male/Total Workforce in Manufacturingservices_f/m/t_<year>.png- Total Female/Male/Total Workforce in Services.informal_labour_f/m/t_<year>.png- Total Female/Male/Total Workforce in Informal Labour.not_in_work_f/m/t_<year>.png- Total Female/Male/Total Workforce not in work.
Measured in FY$2000 International Dollars. Nominal conversions do not use PPP deflations and LCU conversions are anchored to the base year. Total per gridcell.
Regularised Weighted Least Squares [L2] and dasymetric gravity modelling for years prior to 1800 using population weights. Per capita basis points are estimated first, then multiplied outwards per gridcell.
Sources:
- Nordhaus (1994) via De Long (1998).
- Maddison Project Database (2023)
- Kummu et al. (2025)
- World Bank (PPP deflators)
Since GDP (Nominal) is derived analogously to GDP (PPP) with only PPP deflators applied, you should check GDP (PPP) for more details.
Measured in FY$2000 International Dollars. Divides the GDP (Nominal) by Population (Total) per gridcell.
Normalised via Tukey's fences (log-tail normalisation). Cells with <1 inhabitant are excluded. See GDP (Nominal) for more details.
Measured in FY$2000 International Dollars. PPP deflated and anchored to the base year. Total per gridcell.
Regularised Weighted Least Squares [L2] and dasymetric gravity modelling for years prior to 1800 using population weights. Per capita basis points are estimated first, then multiplied outwards per gridcell.
Sources:
- Nordhaus (1994) via De Long (1998).
- Maddison Project Database (2023)
- Kummu et al. (2025)
- World Bank (PPP deflators)
Covariates used by OLS models: Covariates are used for both consistent training and hindcasting.
- HYDE 3.3 (LU):
conv_rangeland,cropland,grazing,ir_norice,ir_rice,pasture,rangeland,rf_norice,rf_rice,shifting,tot_irri,tot_rainfed,tot_rice,uopp_ - Velkscala 1.0:
popc_,popd_,rurc_,urbc_ - Delta covariates (annualised changes in Eoscala/Velkscala rasters).
Measured in FY$2000 International Dollars. Divides the GDP (PPP) by Population (Total) per gridcell. Normalised via Tukey's fences (log-tail normalisation). Cells with <1 inhabitant are excluded. See GDP (PPP) for more details.
Due to legal and proxy changes, Gini measures wealth Gini prior to 1800AD, and income Gini after 1800AD (since legal/debt distortions afterwards render wealth as a metric of inequality somewhat arbitrary).
Rolling ensemble WLS model with population-weighted dasymetric gravity modelling prior to 1800AD. Clamps use Tukey's fences/log-tail normalisation to preserve spatial variance within countries.
Sources:
- Prior to 1800AD: GINI Project Database and others
- 1800AD-1990AD: Gapminder and World Inequality Database (WID)
- After 1990AD: SubNGini by Chrisendo et al. (2025)
View 34 other sources
- Aboagye & Bolt (2018)
- Alfani (2021)
- Alfani et al. (2025)
- Alfania and Carballo (2023)
- Astorga-Junqueira (2017)
- Basri and Lawrence (2020)
- Battistoni and Martinez (2025)
- Beretola et al. (2010)
- Bigsten (1986, 2014)
- Bolt & Hillborn (2016)
- Canbakal (2014)
- Caruto et al. (2024)
- Castaneda-Garza & Bengtsson (2020)
- Castillos (1998)
- de Haas (2021)
- Duffy et al. (2024)
- Fitzgerald (2008)
- Fourie & von Fintel (2011)
- Fourie & von Fintel (2011)
- Furió et al (2020)
- Kohler et al. (2017)
- Kumon (2019)
- Meinzer (2020)
- Mulder et al. (2009)
- Rodriguez Weber (2015)
- Rodriguez Weber (2017)
- Smith (2022)
- Stone (2018)
- Tadei and Alfani (2019)
- Thompson et al. (2021)
- Thompson et al. (2025)
- Williamson (2009)
- Williamson et al. (2008)
- Wronski (2022)
Covariates used by OLS models: Covariates are used for both consistent training and hindcasting.
- HYDE 3.3 (LU):
conv_rangeland,cropland,grazing,ir_norice,ir_rice,pasture,rangeland,rf_norice,rf_rice,shifting,tot_irri,tot_rainfed,tot_rice,uopp_ - Velkscala 1.0:
popc_,popd_,rurc_,urbc_ - Eoscala 1.5:
gdp_nominal,gdp_pc,gdp_ppp,gdp_ppp_pc - Delta covariates (annualised changes in Eoscala/Velkscala rasters).
The sum total of the active workforce in both the female and male labourforce, estimated per gridcell. This is not the same as cohorts of working age (15-65), since it only takes into account the economically active labourforce (LFPR).
See LFPR and Age/Sex for more details on Methodology.
The percentage of working-age cohorts (15-65) currently economically active, stratified by sex.
Rolling Weighted Least Squares (WLS) ensemble with Tukey's fences/log-tail normalisation to preserve intra-country variance. Source training data came from Olivetti (2013) and ILOSTAT. Structural equations for female LFPR (modelled elastically) was derived from Goldin (1994).
Conversely, male LFPR was estimated to be relatively inelastic in terms of global composition; see Costa (2000), Pencavel (1986) for the reasonings behind this decision.
Covariates used by WLS models: Covariates are used for both consistent training and hindcasting.
- HYDE 3.3 (LU):
conv_rangeland,cropland,grazing,ir_norice,ir_rice,pasture,rangeland,rf_norice,rf_rice,shifting,tot_irri,tot_rainfed,tot_rice,uopp_ - Velkscala 1.0:
popc_,popd_,rurc_,urbc_ - Eoscala 1.5:
discretionary_income,disposable_income,gdp_nominal,gdp_pc,gdp_ppp,gdp_ppp_pc,net_income,net_wealth
Estimated sectoral breakdowns per gridcell (agriculture/manufacturing/services/informal labour). Note that labour structures without corresponding state capacity are typically treated as informal labour. This includes non-sedentary work. Those labelled Not in Work are the residual for LFPR, i.e. 1 - LFPR.
⚠️ Warning. Uniquely amongst Confoederal datasets, source work here currently involves the encoding of magic numbers, which we will be keen to remove in the future. Problem?
Superlearner structure trained on disaggregated ILOSTAT, Olivetti data. This structure was pioneered by van Dijk et al. 2022.
Due to the sparsity of empirical data further back, outputs from hybrid superlearners were then subjected to spatial variance algorithms anchored to estimated historical baselines and Clark-Fisher/Chenery & Syrquin 1975 modelling, taking into account GDP per capita and urbanisation.
For industrialisation between 1750-1980, we use the estimates provided by Bairoch 1982 as an intercept to determine shares of manufacturing.
An additive log ratio (ALR) shift is used to preserve intra-country spatial variance.
Definitions: Sectors are defined based on the ILO definition.
- Agriculture: self-enclosed.
- Manufacturing: construction, manufacturing; mining and quarrying, electricity, gas, and water supply.
- Services: public administration, community, social, and other services and activities; trade, transportation, accommodation, food, business, and administrative services.
- Informal labour: labour outside a formal state structure which is generally not taxed. Hunting and gathering/non-sedentary activity falls into this definition.
Covariates used by Superlearner models: Covariates are used for both consistent training and hindcasting. Superlearners are 50% OLS and 50% Random Forest. See Source Code for more details on parameters.
- HYDE 3.3 (LU):
conv_rangeland,cropland,grazing,ir_norice,ir_rice,pasture,rangeland,rf_norice,rf_rice,shifting,tot_irri,tot_rainfed,tot_rice,uopp_ - Velkscala 1.0:
popc_,popd_,rurc_,urbc_ - Eoscala 1.5:
discretionary_income,disposable_income,gdp_nominal,gdp_pc,gdp_ppp,gdp_ppp_pc,gini,lfpr_f,lfpr_m,net_income,net_wealth - Delta covariates (annualised changes in Eoscala/Velkscala rasters).
The total amount of workers in the given sector (agriculture/manufacturing/services/informal labour). Not in work constitutes the population of working age not actively in employment (1 - LFPR), defined as cohorts aged 15-65 (ILO/World Bank definition), stratified by sex. This currently has the weakness of excluding some forms of child labour in earlier periods.
See methodology in Professions (%) for more details.
Per household fiscal statistics, modelled in average terms per gridcell. Note that national accounts for certain places was incomplete, and for such regions, regional fallbacks were used for training.
National accounts data was compiled from the World Inequality Database (WID) and BR Mitchell's International Historical Statistics (ISSN: 2947-1583). Training for wealth/income relied on Regularised Least Squares [L2] and Tukey's fences, log-tail normalisation.
LCU deflators were borrowed from the World Bank. After disaggregation, such data served as training targets for discrete WLS models.
Definitions:
- Net wealth:
ahweali992: (Net personal wealth) - Net income:
aptinci992: (Pre-tax national income) - Disposable income:
adiinci992: (Post-tax national income) - Discretionary income:
asavhoi992+aindgoi992: (Savings rate + government-provided services)
Covariates used by WLS models: Covariates are used for both consistent training and hindcasting.
- HYDE 3.3 (LU):
conv_rangeland,cropland,grazing,ir_norice,ir_rice,pasture,rangeland,rf_norice,rf_rice,shifting,tot_irri,tot_rainfed,tot_rice,uopp_ - Velkscala 1.0:
popc_,popd_,rurc_,urbc_ - Eoscala 1.5:
gdp_nominal,gdp_pc,gdp_ppp,gdp_ppp_pc,gini - Delta covariates (annualised changes in Eoscala/Velkscala rasters).